
You set a stop-loss at a level that looks completely reasonable — just below a clear support line, right where every trading course tells you to put it. The market grinds along, gets close, and then suddenly spikes through your level on a sharp wick, triggers your stop, and reverses almost immediately back in the direction you originally expected. You’re out. The trade you would have won, had you just held on a little longer, is gone.
If this has happened to you more than once, you’ve probably wondered whether something more deliberate is going on — whether algorithms, market makers, or “smart money” are specifically targeting your stop-loss. The honest answer is more interesting, and more useful, than either “yes, they’re out to get you” or “no, it’s all in your head.” Something real is happening here, it has a name, and understanding the actual mechanics will change how you think about where you place your stops — but it isn’t quite the conspiracy it’s often described as either.
What “Stop Hunting” Actually Means
Stop hunting (also called a liquidity grab, liquidity sweep, or stop run) refers to price moving briefly through a level where a large number of stop-loss orders are known or suspected to be clustered, triggering those stops, before often reversing direction shortly after.
To understand why this happens, you need to understand what a stop-loss order actually is from the market’s perspective: it’s not a passive instruction sitting quietly in the background. A stop-loss is a pending market order — the moment price touches it, it converts into an active order to buy or sell at the best available price. That single fact is the entire foundation of everything else in this topic.
Large market participants — institutional traders, market makers, and proprietary trading firms — frequently need substantial liquidity to enter or exit big positions without causing major slippage (the difference between the price they expected and the price they actually got). One of the most efficient sources of that liquidity is exactly the cluster of stop-loss orders sitting at predictable technical levels. When price reaches that zone and those stops trigger, they instantly become a wave of market orders flowing in one direction — which is precisely the liquidity a large player needs to fill their own order.
Why Stop Losses Cluster in the First Place
This is the part of the mechanism that’s almost entirely the retail trader’s own doing, even though it doesn’t feel that way in the moment.
Most beginner and intermediate traders are taught nearly identical rules about where to place a stop: just below a recent swing low, just above a recent swing high, just beyond a round psychological number, or just past an obvious support or resistance line. Because an enormous number of traders are taught the same handful of rules from the same handful of sources, an enormous number of stop-losses end up sitting in nearly the same place.
This creates what’s often called a liquidity pool — a dense cluster of stop orders bunched within a narrow price range, sitting just beyond an obvious chart level. The more “textbook perfect” a level looks — a clean double top, an obvious round number, a level that’s been respected multiple times — the more predictable, and therefore more attractive, that cluster becomes. As one trading analysis puts it bluntly: if a level looks too perfect for a stop-loss, it tends to get hunted, precisely because so many other traders placed their stop in the exact same spot for the exact same textbook reason.
How the Mechanism Actually Works, Step by Step
Putting the pieces together, here’s roughly what a stop hunt looks like in practice:
- Identification — A large participant or algorithm identifies a price zone where stop-losses are likely clustered — typically just beyond an obvious support/resistance level, recent swing high/low, or round number.
- The probe — Price is pushed, often with relatively small order flow during lower-liquidity periods, toward that zone. This is sometimes described as “nudging” price using comparatively small size, deliberately avoiding the kind of large, obvious order that would tip off other market participants.
- The sweep — As price crosses into the cluster, stop-losses begin triggering and converting into market orders, creating a cascade: each triggered stop adds market-order pressure that can trigger the next stop just beyond it, briefly accelerating the move.
- Absorption — The large participant uses this sudden burst of opposing liquidity to fill their own large order at a better price than they could have gotten by simply placing one big order into a thin, normal market.
- The reversal — Once the liquidity has been absorbed and the large position is filled, there’s often no remaining reason for price to continue in that direction, and it frequently snaps back the other way — which is exactly the moment that looks, from a retail trader’s perspective, like “the market hit my stop and then immediately went exactly where I thought it would.”
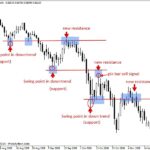
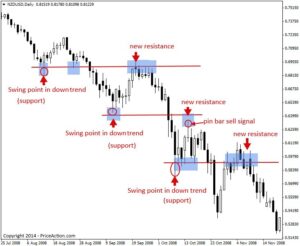
The classic visual signature of this pattern is a sharp wick that pierces clearly through a support or resistance level on elevated volume, but whose candle body closes back within the prior range — a strong signal, in the eyes of traders who study this pattern, that liquidity was swept rather than that a genuine breakout occurred.
Is This Actually Illegal Manipulation, or Just… How Markets Work?
This is the single most important and most contested question in the entire topic, and the honest answer is: it depends entirely on intent and method, and the line between the two is exactly where regulators draw it.
The case that it’s mostly normal market structure
A significant amount of legitimate market commentary pushes back hard on the idea that “they’re hunting your stop specifically.” The argument goes roughly like this: market makers and high-frequency trading firms exist primarily to provide liquidity and manage their own inventory risk, not to single out retail traders. When price moves toward a stop cluster and triggers it, it’s frequently coincidental — the result of price simply needing liquidity somewhere nearby to facilitate normal order flow, not a deliberate campaign against any individual trader’s specific stop order. From this view, market makers don’t actually care whether the orders they’re absorbing are stop-losses being triggered or simply normal limit orders sitting at the same price; the liquidity behaves the same either way, and labeling all of it “manipulation” overstates both the intent and the precision involved. Confirmation bias plays a role too: traders remember the times their stop got hit right before a reversal far more vividly than the many times price simply continued in the same direction after their stop was hit for entirely ordinary reasons.
There’s a real point buried in this pushback: the term “stop hunting” implies a level of deliberate, targeted intent that’s hard to prove and, in the vast majority of cases, almost certainly isn’t happening to you specifically. Nobody is watching your individual account and plotting against your particular stop order. What’s happening is structural and probabilistic — large players are responding to where liquidity is statistically likely to be clustered, not where any one retail trader’s stop happens to sit.
The case that genuine, illegal stop hunting does happen
At the same time, it would be inaccurate to say this is purely a retail myth with zero basis in real misconduct — because regulators have, in specific documented cases, found exactly this behavior occurring as part of illegal market manipulation.
In a notable enforcement action, the U.S. Commodity Futures Trading Commission found that traders at a major financial institution attempted to manipulate the price of precious metals futures contracts using spoofing techniques — and the regulator’s order specifically described part of this conduct as trading in a manner designed to trigger customer stop-loss orders, as one tactic within a broader manipulative spoofing scheme spanning several years. This is, functionally, a regulator-confirmed example of literal “stop hunting” as part of a prosecuted, penalized case of market manipulation.
This is meaningfully different from the everyday liquidity-seeking behavior described in the section above. The illegal version typically involves spoofing — placing orders with no genuine intent to execute them, purely to create a false impression of market demand or supply, then canceling those orders once they’ve achieved the desired effect on price. U.S. regulators have pursued and won enormous penalties in cases involving exactly this kind of conduct, including a record-setting $920 million settlement against a major bank for an eight-year spoofing scheme spanning hundreds of thousands of spoof orders in precious metals and Treasury futures.
So the honest, complete picture is this: the everyday version of stops clustering and getting swept near obvious technical levels is largely just an emergent feature of how liquidity-seeking markets work, given that so many retail traders place stops in predictable places. But a narrower, more deliberate version — where an order is placed specifically and falsely to manufacture the appearance of demand or supply in order to trigger nearby stops — is real, has happened, has been investigated, and has resulted in some of the largest financial penalties regulators have ever imposed. Both things are true. They are not the same phenomenon, even though they can look identical on a price chart.
Why It Feels Personal Even When It Isn’t
It’s worth addressing directly why this pattern feels so targeted, because the psychological experience of it is genuinely consistent and worth taking seriously, even if the underlying cause usually isn’t personal.
You are, by definition, more likely to notice and remember the specific instance where your stop got hit right before a reversal than the instances where it simply got hit because the market kept moving in that direction. This is a basic feature of how memory and pattern recognition work, not a flaw unique to any individual trader. Combine that with the very real, well-documented mechanism described above — stops genuinely do cluster at predictable levels, and large players genuinely do seek out liquidity wherever it’s concentrated — and you get a pattern that’s emotionally compelling, partially grounded in real market structure, and easy to overinterpret as a personal vendetta that it almost certainly isn’t.
What You Can Actually Do About It
Whether you think of this as “the market hunting stops” or simply “predictable liquidity clustering,” the practical response is largely the same, and it doesn’t require believing in a conspiracy to be useful.
1. Stop placing your stop at the obvious level
If a support or resistance level is clean and obvious enough that you immediately identified it as a good place for a stop, it’s reasonably likely that a large number of other traders identified the exact same level for the exact same reason. Placing your stop slightly beyond the immediately obvious zone — sometimes called leaving “breathing room” — moves you outside the densest, most predictable part of the cluster.
2. Size your stop relative to volatility, not just to a chart level
A widely cited rule of thumb is to keep your stop at least 1.5 to 2 times the Average True Range (ATR) away from your entry, particularly during periods of lower liquidity, rather than placing it at a fixed, tight distance purely based on where a chart pattern happens to end. A stop that’s tighter than the market’s normal noise level is, almost by definition, a more likely target for an ordinary price swing, whether or not any deliberate hunting is involved.
3. Watch for the specific signature of a completed sweep before re-entering
If you’ve been stopped out and are deciding whether to re-enter, a useful pattern to watch for is a sharp wick through the level on a burst of volume that closes back within the prior range — this is widely treated as a signal that liquidity has been absorbed and a genuine reversal may follow, as opposed to a slow, sustained grind through the level, which more often indicates an actual change in market conviction rather than a quick liquidity grab.
4. Consider position sizing over stop placement as your primary risk control
Rather than trying to outsmart where “they” will hunt next, many experienced traders shift their primary risk management away from a single tight stop and toward smaller position sizing combined with a wider, more volatility-appropriate stop. This reduces the odds that an ordinary, non-targeted price swing wipes out the position before the underlying thesis has had a chance to play out.
5. Be skeptical of strategies that promise to “trade with the hunters”
A cottage industry has grown up around teaching traders to identify and trade alongside supposed institutional stop hunts — buying right as a sweep completes, for instance. Some of the underlying logic (price often does reverse after a clean liquidity grab) is grounded in genuine market structure, but treat any framework promising to reliably anticipate exactly when and where the next “hunt” will occur with real caution; you’re attempting to predict the deliberate behavior of a counterparty whose actual intent you cannot directly observe, and overconfidence in this specific skill is itself a well-documented contributor to trading losses.
Final Thoughts
The fear that “they’re hunting my stops” sits at an unusually honest intersection of real market mechanics and understandable but exaggerated retail folklore. The underlying structure is genuinely real: stop-loss orders convert into market orders the instant they trigger, retail traders predictably cluster their stops at the same obvious technical levels, and large participants do seek out exactly this kind of concentrated liquidity to fill substantial positions efficiently. None of that requires any conspiracy — it’s simply how a liquidity-driven market behaves when a large fraction of its participants were taught to place their risk management in the same predictable places.
At the same time, the line between “the market doing what markets do” and actual illegal manipulation is real, it has been crossed before in ways regulators have specifically investigated and punished, and it specifically involves deceptive tactics like spoofing rather than simply normal price discovery. The practical lesson isn’t to assume either that nothing is happening or that everything is a deliberate plot against you personally — it’s to recognize that your stop-loss placement is, in a very literal sense, information the market can see and respond to, and to manage your risk accordingly: wider, more volatility-aware stops, smaller positions, and placement that doesn’t sit at the most obvious, most crowded price on the chart.